Critical value works as a limit that separates the rejection region from the acceptance region. The critical value is compared with the calculated test statistic for deciding whether to reject or accept the null hypothesis. When critical value crosses test satistics, the null hypothesis must be rejected. The concept of critical value is important for hypothesis testing, confidence intervals, and making decisions for processes. Here we will learn the definition and formula of critical values. In addition, we will cover the solved example of critical values..

Critical value: Definition
The critical value is such a value that is compared with the measured test statistic for deciding whether to reject or accept the null hypothesis. reject the null hypothesis and accept the alternative hypothesis if test states are higher than the critical value.
For alternative terms, critical value is hypothesis testing that splits the distribution graph in two regions, which are acceptance and rejection regions.
The null hypothesis is rejected when the value of test statistics reduces in the reject region that is defined with critical values.
With that, the null hypothesis is accepted if the test statistics are inacceptance regions. The critical value works like a threshold for deciding whether to reject or accept the null hypothesis based on observed test results.
The criterion value is taken from the selected level of significance. Normally, the alpha (α) symbol is used for showing the level of significance. The critical value is related to a specific probability or confidence level related to the test statistic used in the analysis.
Formulas to calculate a critical value
Formal used for finding critical value in statistics based on certain statistical tests used. Different statistical tests come with certain critical formulas. Z, T, χ2, and F are commonly used test statistics.
The level of significance (α) is used in all critical formulas. So we will learn how to calculate alpha (level of significance).
- Choose a confidence level like 95 percent that is used in statistical confidence levels.
- It is needed to transform a value into decimal format. i.e., 95/100 = 0.95
- Minus confidence level from 1 to get alpha. i.e., α = 1 – 0.95 = 0.05
- In a 2-tailed test deivide, it resulted in 2. While for the one-tailed test, do not divide by 2.
Alpha values will be used in the following statistical tests.
T: Critical value
T critical value is used when population standard deviation is not known and sample size is less as compared to 30. T critical value can get with these points
- Measure level significance (alpha).
- Find the degree of freedom that is based on sample size (n). For one sample t-test, the degree of freedom is n – 1. For a two-sample t-test, the formula of a degree of freedom is df = (n1 + n2) – 2.
- Chek T table existing in row based to degress of freedom df and find column close to required level of significance (alpha). The intersection of the row and column will give you the t-critical value.
Z: Critical value
The z critical value is used when the population standard deviation is known and the sample size is higher as compared to or equal to 30. Z critical value is getting with these steps.
- Measure the value of the level of significance.
- For a two-tailed test, minus alpha from 1. Minus alpha level from 0.5 for a one-tailed test.
- Find the resulted value in the Z table and put the value of the intersection row and column. The find value will be z-critical value.
F-critical value
The use of the F critical value is more common than variance among different populations. That is used in both ANOVA and regression and analysis. F critical value get with these steps
- Measure the value of the level of significance.
- For numerator degress of freedom (df1), Minus 1 from the first sample size. For denominator degress of freedom (df2), Minus 1 from the second sample size.
- Use the F distribution table; the intersection of row corresponding to df1 and column corresponding to df2 will be an F-critical value.
χ2 Critical value
It is used rather than observed frequencies with expected frequency for assuming either observed data deviates from what can be expected under the null hypothesis. χ2 value can be obtained by following steps:
- Measure the value of the level of significance.
- Find the degree of freedom (df), i.e., df = n – 1.
- Measure the row-corrosive degree of freedom. Locate the column that relates to the level of significance. The intersection of the row and column will provide the chi-square critical value.
Solved example of critical value
Example
Determine the one-tailed t-critical value if the sample size is 7 and the level of significance is 0.05.
Solution
Step 1: Here,
Level of significance = α = 0.05
Sample size = n = 7
Step 2: Evaluate the degree of freedom (df), For this minus 1 from the sample size (n),
df = 7 – 1 = 6
Step 3: Look at the t-table and locate the row corresponding to the degree of freedom (df), which is 6 in this example. Find the column closest to your desired level of significance (alpha). The intersection of the row and column will give you the t-critical value.
The result will be 1.9437.
Try online critical value calculators to find the results of critical value problems with tables. Below we attached a screenshot of the above problem solved through a t critical value calculator.
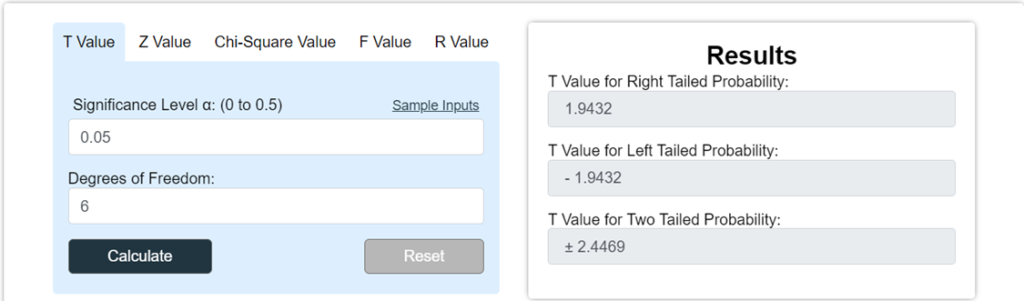
Hence, the degree of freedom (df) and alpha (α) intersect 1.9437, so 1.9437 is our t-critical value.
Conclusion
Thus, we have concluded that critical value plays a fundamental role in statistics. In this article, we discussed everything about critical value- its definition, its formula, and how to calculate it in different statistical tests. With the help of examples, we tried to understand this topic. After reading this article, you can find critical value for any statistical test. follow for more The Engreening Knowledge