Hello, readers welcome to new tutorial. In this post, we will discuss How to use Charts and Graphs in LabVIEW. Nowadays there is use of graphical devotion of different parameters has become very common and offers different features to undertaking the numerous tools and features.
The graphical denotation of different values of symbols is called a chart and graphs are drawn to study the relation among different terms. Labview is software that is designed for engineers that help to make charts and graphs for different parameters. Here we will learn a project and apply the charts and graphs to have their detailed understanding.
How to use Charts and Graphs in LabVIEW
- Here we will make projects in which temperature conversion occurs. There are three types of temperatures is done.
- Formulas for temperatures conversion is mentioned here
-
Fahrenheit to Celsius Conversion
C = 5/9 ( F – 32 )
Celsius to Fahrenheit Conversion
F = 9/5 °C + 32
Celsius to Kelvin Conversion
K = C + 273
- You can use any type of temperatures conversion according to your desired projects and can apply charts and graphs.
- Here we will make a project where Fahrenheit conversion is done.
-
Fahrenheit to Celsius Conversion
C = 5/9 ( F – 32 )
- First of all, we do the centigrade to Fahrenheit conversion.
- For this move to the front panel select the numeric control and numeric indicator.
- Assign the name to numeric control centigrade and numeric indicator to Fahrenheit.
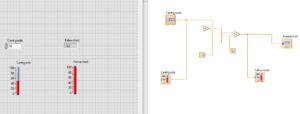
- After that select 2 thermometers and assign them the names centigrade and Fahrenheit
- It looks like this

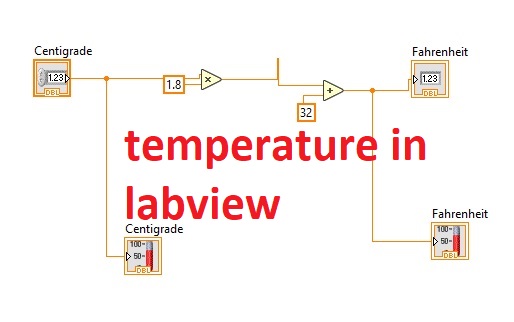
- Now go to block diagram and press right and select the multiply option and link it to centigrade and other terminals write 1.8
- After that select the add option and link it to the multiply and at other terminal write 32.
- After that link to the added terminal to Fahrenheit

- Now make connection shown in below figure
- \


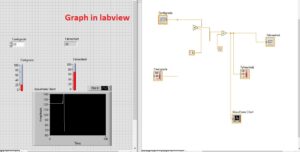
- Now move to front panel and press right and select the graph and link it to the cirucuti than you can see the resuktatnt waveform in the below figure.

That is all about the How to use Charts and Graphs in LabVIEW. I have explained the details about the How to use Charts and Graphs in LabVIEW through making circuits and a detailed overview of that circuit. If you have any further query ask in the comments thanks for reading have a good day see you in next post.


