High friends, I hope you all doing great. In today’s post, we will have a detailed look at Two Methods for Measuring Frequency Response. The main techniques for measuring the filter response of frequency measurements are discrete point measurement and swept frequency measurements.
In this post, we will discuss these 2 methods one by one with the detail and discuss their circuit and other related parameters. So let’s get started with Discuss Two Methods for Measuring Frequency Response.
Discrete Point Measurement
- Below the figure, you can see the circuit configuration for getting the filter output voltage calculations at different values of input frequency value with the general usage of any measuring device.
- The process is described here with the details.
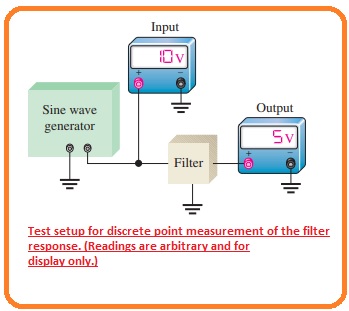
- Adjust the amplitude of the sinusoidal signal generator at the required voltage level.
- Adjust the frequency of the sinusoidal signal generator at a level that is less than the required critical frequency of filter under observation. In case of low pass filter adjust the frequency close to zero hertz. in case of bandpass filter adjust the frequency less than the required lower critical frequency.
- Increase the value of frequency in already adjusted steps to permit certain information for the correct response curve.
- Retain the constant value of input single amplitude and change the value of frequency.
- Measure every value of output voltage at each value of frequency.
- After measuring the specific values make a graphical representation of output voltage with the frequency.
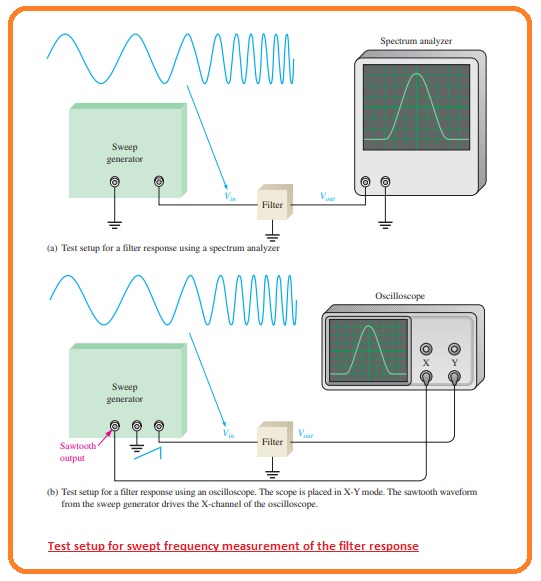
Swept Frequency Measurement
- This technique needed further elaboration testing devices than the previous technique, but this technique is efficient than the discrete point and provides correct response curvature.
- The circuit for this technique is shown in the below figure. In which swept frequency generator and spectrum analyzer is used.
- diagram denoted as b indicates that how testing can be performed with the usage of the oscilloscope.
- The swept-frequency generator generates a constant amplitude output signal whose frequency rises in a linear way among the 2 preset restrictions.
- The spectrum analyzer is compulsory to elaborate oscilloscope which can be measured for a required frequency division rather than the general time setting.
- So input frequency at the filter sweeps in the already adjusted range the response curvature is located at the display of spectrum analyzer.
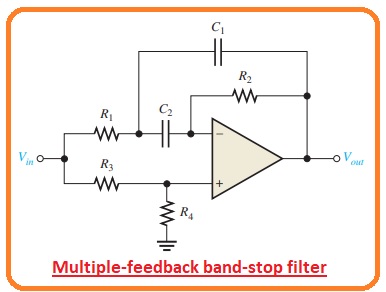
Multiple-Feedback Band-Stop Filter
- Below figure indicate the circuit configuration of multiple feedback bandstop filter.
- Note that this arrangement i like the bandpass category which we discussed in previous post with the difference is that resistance R3 has changed its position and R4 has inserted.
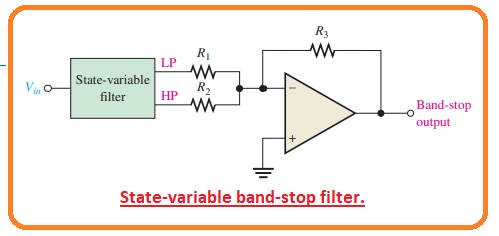
State-Variable Band-Stop Filter
- adding the low pass and high pass responses obtained with the state variable filter to the summing amplifier makes a band stop filter can be seen in the below figure.
- The main usage of this category of the filter is reducing the sixty-hertz frequency hun in audio networking with the adjustment of the center frequency to six.
What is the method of representing frequency response?
- The representation of the frequency response of the system is called a Bode plot. The magnitude of the term is frequently an independent constant with an angle equal to zero or 180 degrees based
What are the two ways to measure frequency?
- Sound wave frequency measured with a frequency counter or through a spectrum analyzer. These modules operated with the use of a microphone for converting sound waves into electrical signals.
What is the best frequency response?
- The ideal speaker frequency response is based on the complete full spectrum of human hearing, that is, 20 Hz to 20,000 Hz. With smooth response on this range. Accurate sound reproduction is difficult since it has different factors, such as speaker design and human hearing restrictions.
What are the two types of frequency response plots?
- There are two different methods for viewing the frequency response, that is, the Bode plot or via the Nyquist diagram. These two methods show the same data difference exists in methods where data is shown.
What are the techniques of frequency analysis?
- The main type of time frequency analysis is the short-time Fourier transform. But wavelets and least squares spectral analysis are used for unevenly spaced data.
What are the different types of frequency measures?
- The main measurements for health outcomes or frequency are risk, rate, and prevalence. The individual at risk comes with a ten percent chance of developing a given health result for more than a 5-year period of time.
That is all about Two Methods for Measuring Frequency Response I tried my level best to make it simple for you if you have any further query ask in comments. Thanks for reading. Have a good day