 Hello friends, I hope all of you are fine. In today’s tutorial, we are gonna have a look at Synchronous Generator Capability Curves. This curve of the synchronous generator tells about the limits in which a generator can continue its operation without any damage. It also recognized as the functioning chart of the synchronous generator. The restrictions that are defined by this curve are described here. The load associated with the generator should according to the rating of the generator. The load of the generator also follows the rated values of the generator’s mechanical power source (prime mover).
The value of the IF should be in the bearable value of the generator, so it cannot damage the windings. The angle of the load must be less than ninety degrees. In today’s post, we will have a look at how these limits are practically works and their effects. So let’s get started with the Synchronous Generator Capability Curves.
Synchronous Generator Capability Curves
- The heats limits of the stator and the rotor of the generator, and some other exterior restrictions can be defined by the generator capability curve.
- A capability curve can be made from the complex apparent power of the generator S=P +Qj.
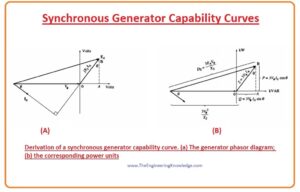
- It is found from the phasor diagram of the generator, by supposing that the Vø has constant value at the rated voltage of the generator.
- In a given diagram, you can see the phasor diagram of the generator when it is connected with the inductive load and its rated voltage.
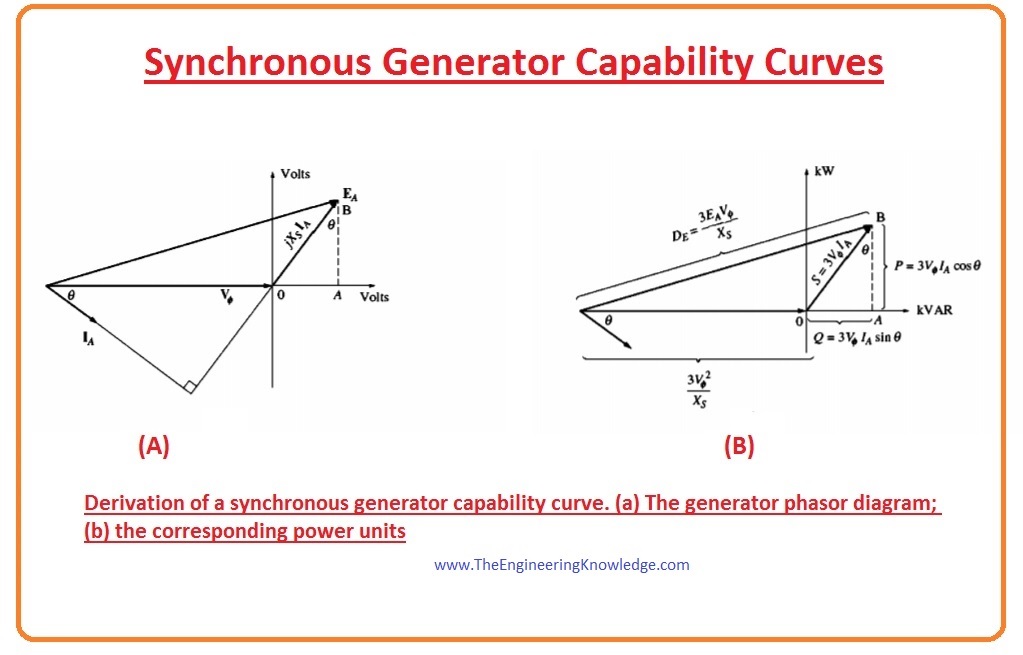
- An orthogonal set of axes is constructed on the diagram with its initial point at the tip of Vø and represents in V.
- In the diagram that is denoted as A, the perpendicular part AB has the length of XsIAcosø and the length of the horizontal part (OA) is XsIAsinø.
- The active power of the generator is given as.
P=3VøIAcosø
- The reactive power Q of the synchronous generator is given as.
Q= 3VøIAsinø
- The apparent power S is given as.
S =VøIA
- So the vertical (AB) and the horizontal (OA) components of this curve can be written in active and reactive power. Its drawn in above figure and denoted as B.
- The alteration factor required to change the gage of the axes from volts to voltampere’s (power units) is 3Vø/Xs
P=3VøIAcosø= 3Vø/ Xs (XsIAcosø)
Q= 3VøIAsinø=3Vø/ Xs (XsIASinø)
- At the axis of the voltage, the vertex of the phasor diagram is at the negative of the Vø on the horizontal axis.
- The vertex of the power diagram is.
Q= 3Vø/Xs (-Vø)
= -(3V2ø)/(Xs)
- The field current of the generator is directly proportionate to the flux of the generator and the flux is directly proportionate to the internal generated voltage EA =Kwø
- The length equivalent to internal generated voltage EA on the power diagram is written as.
DE = -(3EAVø)/(Xs)
- The armature current is directly proportional to the XsIA and the length equivalent to XsIA on the power diagram is 3VøIA.
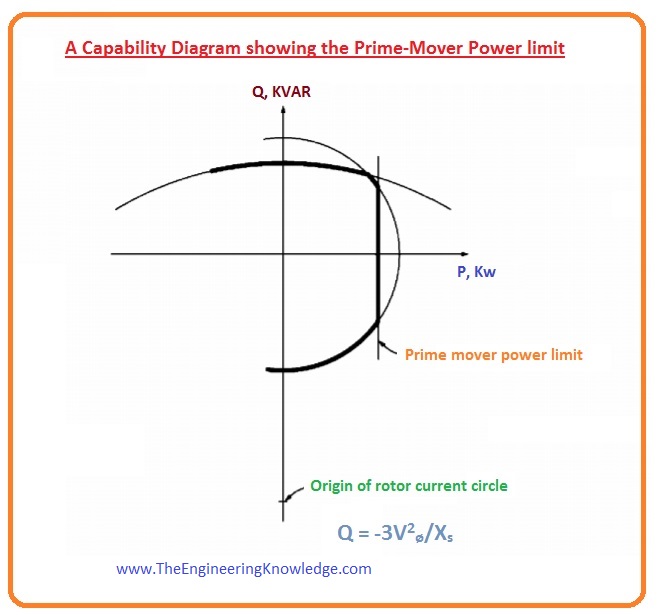
- The concluding of the synchronous generator capability is shown in a given figure.
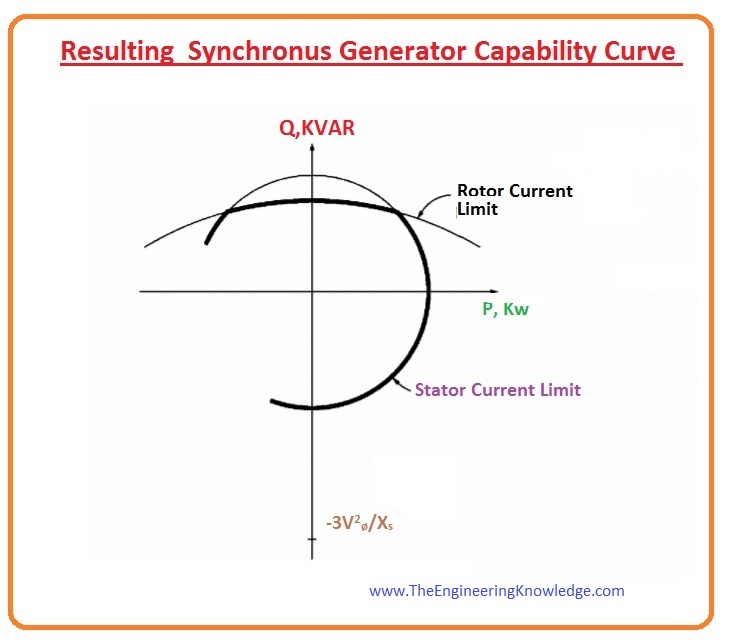
- It is the graphical representation between the active power and the reactive power, active power is shown on the x-axis and Q on the y-axis.
- Lines of constant IF match to lines of constant internal generated voltage, which are revealed as circles of magnitude 3EAVø/Xs positioned on the point.
Q = -3V2ø/Xs
- The IA boundary looks like the circle equivalent to the rated IA or rated KVA’s, and the IF boundary looks like a circle equivalent to the rated field current or internal generated voltage.
- The points that exist in both circles are a safe functioning points for the generator.
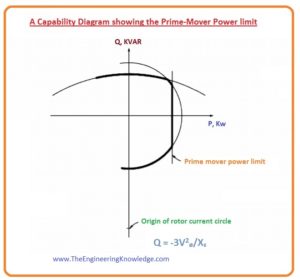
- We can also represent the other limitations on the figure, like extreme power of the prime mover and the stationary stability boundary. It is shown in a given diagram.
Short-Time Operation and Service Factor of Synchronous Generator
- The most significant restriction for the normal working of the generator is the heating of its both windings, armature and field windings.
- These heating restrictions normally apply at a point below the extreme power that the generator can provide mechanically or magnetically.
- The normal synchronous generator has the ability to provide three hundred percent power of its rated power till that points it both windings armature and field burn out.
- This capability of the generator to provide higher power than its rated power is used to deliver temporary power surges for starting of the motor and analogous load transients.
- There is a possibility to run generator power larger than the rated power for a long time, as long as the windings do not have time to heat up beforehand the extra load is detached.
- For instance, a generator that can provide power to the one-megawatt load indefinitely can has the ability to provide power to the 1.5-megawatt load for some minutes without serious damage, and for a gradually larger time at less power.
- However the load should finally be detached, or the windings will be damaged.
- As the power will increase over the rated value the generator will bear it only for a couple of minutes or can damage it.
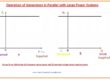
- The given diagram shows this factor.
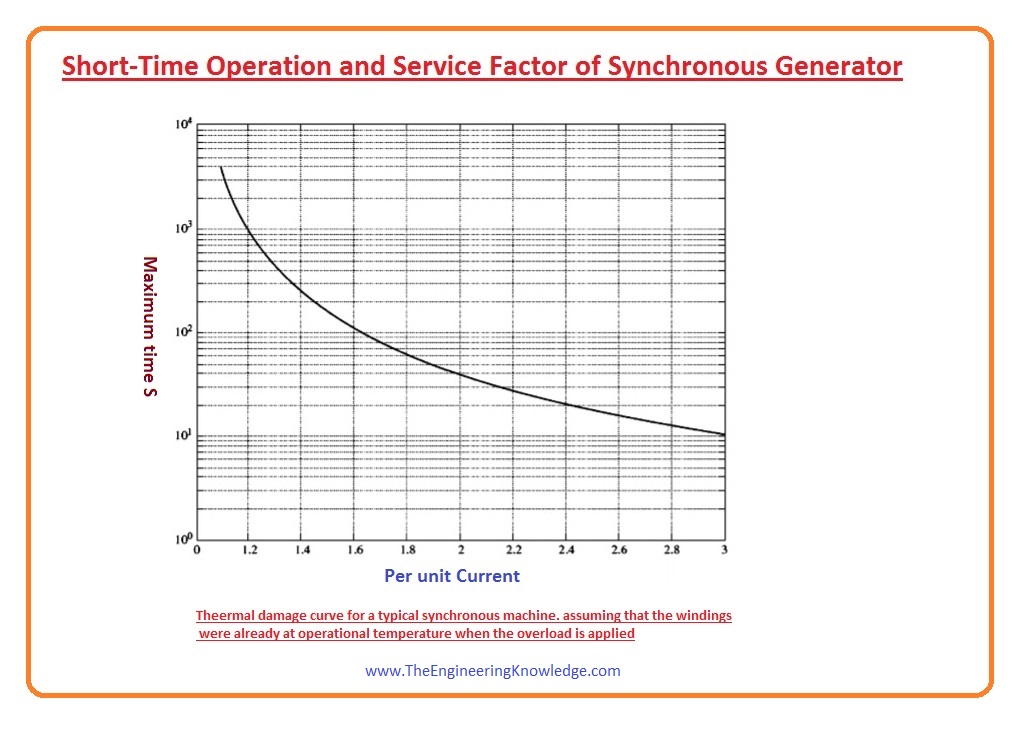
- You can see from the picture that for overloading the required time is in s for heating of the generator.
- ln this generator, a twenty % overloading can endure for a thousand seconds, a hundred % overloading can be bear for thirty seconds, and a two hundred% overloading can be endured for ten sec before harming the generator.
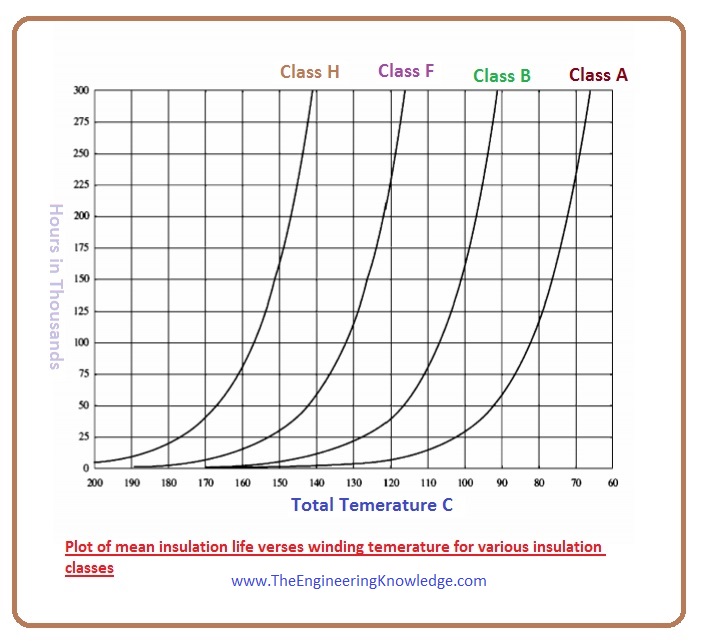
- The extreme value of the temperature that any electrical machine can bear depends on the winding’s insulation class.
- There are 4 main classes of winding insulation A, B, F, H.
- Whereas there is some changing intolerable temperature that relies on the design of the machine and temperature calculation technique.
- these classes usually resemble temperature increases of sixty, eighty, one hundred-five, and one hundred twenty-five Celsius, correspondingly, over ambient temperature.
- The larger the insulation class of an electrical machine, then large the amount of power can get out from the machine without any damage to the machine.
- Heating and damaging the windings in any electrical machine is a very common issue.
- It is a general rule that for every ten Celsius increment in the temperature of the windings that is mentioned on the machine’s nameplate, the average lifetime of a machine will remain half. Can see in the figure.
- Nowadays insulation materials are less vulnerable to break-down than before, but temperature increment still severely decreases their lifetime.
- Due to these reasons never connect the load beyond the limit of the synchronous machine.
How well is the power requirement of a machine known?
- Before connection, there are only estimated approximations of load, due to this, general machines normally have a service factor.
- The service factor is the ratio of the extreme power of the machine to the power mentioned on the nameplate of the machine.
- The generator that has a service factor of 1.15 can be functioned at one hundred percent % of the rated load without any damage.
- The service factor on a generator offers a boundary of fault in case the loads were inappropriately assessed.
You can also read some related topics to synchronous generators that are listed here.
Introduction to Synchronous Generator
Synchronous Generator Equivalent Circuit
Synchronous Generator Phasor Diagram
Synchronous Generator Power and Torque
Synchronous Generator Parameters
Synchronous Generator Operating Alone
Synchronous Generator Parallel Operation
Synchronous Generator parallel with Large Power system
Synchronous Generator Parallel with same Size Generator
Synchronous Generator Transients
Faqs
- The curve denoted boundary of all working points in MW/MVAr plane it is made with real power on the horizontal axis and the synchronous generator is like a letter D shape, so it is called a D-curve
- capability Curve of a Generator explains boundaries where it can provdies reactive power continuously without overheating.
- The generator is defined in the form of MVA and power factor at a certain terminal voltage.
- The capacity of a synchronous generator is equal to multiple of voltages per phase, current per phase, and number of phases. it is defined in MVA for larger generators and kilovolt-amperes (kVA) for small generators.
- The V and Inverted V curves of synchronous motor. V curves are plated armature current with field current for constant loads, defining how armature current changes with excitation. Inverted V curves plot power factor with field current.
- The V curves of the generator is a graph of stator current as a function of field current and holding output constant. Curves suppose that the generator is connected with infinite but with constant terminal volts.
What are the limits of capability curve?
- Active power provided by the generator is limited by the power delivery features of the turbine. Reactive power that generator can provide continuously without overheating with 3 limits Armature Current Limit, Field Current Limit, and End Part Heating Limit
- The open circuit saturation curve of the synchronous generator is a graph of output open circuit voltage as function of excitation current or field. The curve is plotted with a synchronous impedance curve.
That’s all about Synchronous Generator Capability Curves I have mentioned each and everything related to Synchronous Generator Capability Curves. If you have any query ask in the comments. See you in next tutorial.


I would like to thank you for the efforts you have put in writing this blog. I am hoping the same high-grade blog post from you in the upcoming also. Actually your creative writing abilities has inspired me to get my own blog now. Actually the blogging is spreading its wings fast. Your write up is a great example of it.