A pressure-temperature chart is a tool used in HVAC systems, air conditioning, and industry. These charts show details of pressure and temperature according to certain thermodynamic conditions. Engineers use these charts for getting details for pressure according to saturation temperature, and they help to get the required operating conditions.
P-T charts are important for steam systems, heat pumps, and industries where pressure and temperature affect fluids. In this post, we will cover details about pressure-temperature charts, their working principles, types, applications, and how to read them.
What Is a Pressure-Temperature (P-T) Chart?
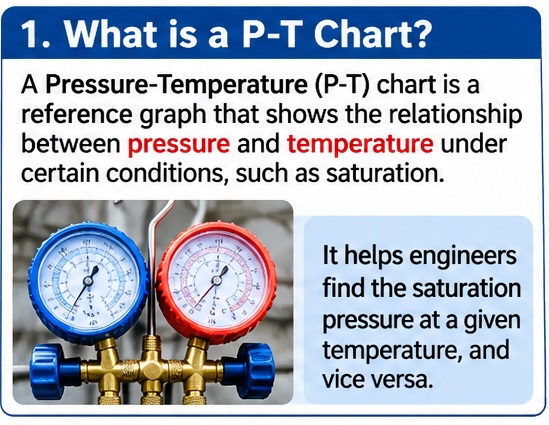
A pressure-temperature (P-T) chart is a reference graph that shows the relationship between pressure and temperature under certain conditions. For the refrigeration industry, it shows saturation pressure based on the saturation temperature of a refrigerant.
For example, if the refrigerant changes phase, from liquid to vapor or vapor to liquid, its saturation pressure varies according to temperature. P-T charts offer values for engineers to find saturation temperature obtained from pressures taken at certain temperatures.
Each refrigerant comes with a different P-T relationship due to its chemical composition and thermodynamic properties being different. Therefore, technicians use the correct chart for the refrigerant installed in the system.
Types of Pressure-Temperature Charts
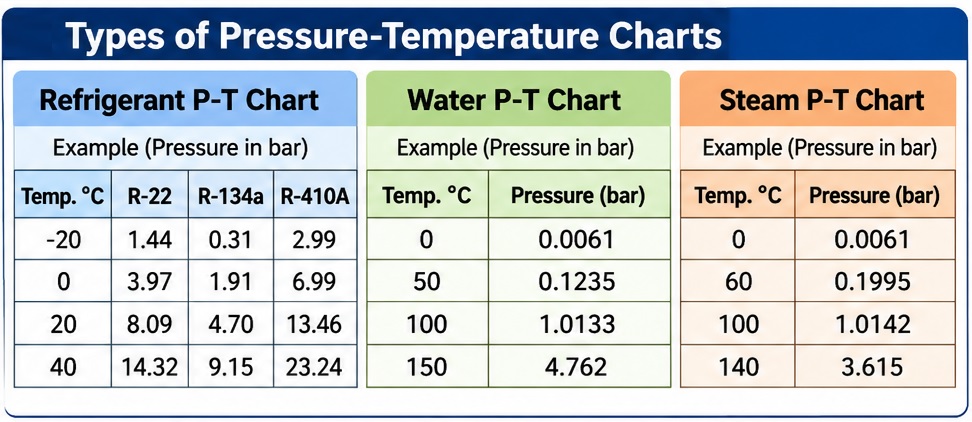
Pressure-temperature charts come for different industries and materials and give details according to fluids.
Refrigerant P-T Comparison Chart
| Temp. °C | Temp. °F | R-22 | R-134a | R-410A | R-32 | R-404A | R-290 |
| -20 | -4 | 1.44 | 0.31 | 2.99 / 2.98 | 3.04 | 2.06 / 1.99 | 1.43 |
| -10 | 14 | 2.53 | 0.99 | 4.73 / 4.71 | 4.81 | 3.38 / 3.29 | 2.44 |
| 0 | 32 | 3.97 | 1.91 | 6.99 / 6.97 | 7.12 | 5.09 / 4.99 | 3.73 |
| 10 | 50 | 5.8 | 3.13 | 9.87 / 9.83 | 10.06 | 7.26 / 7.14 | 5.35 |
| 20 | 68 | 8.09 | 4.7 | 13.46 / 13.42 | 13.73 | 9.96 / 9.83 | 7.35 |
| 30 | 86 | 10.91 | 6.69 | 17.88 / 17.82 | 18.26 | 13.27 / 13.13 | 9.78 |
| 40 | 104 | 14.32 | 9.15 | 23.24 / 23.17 | 23.77 | 17.28 / 17.14 | 12.68 |
Refrigerant Pressure Chart in PSIG
| Temp. °C | R-22 | R-134a | R-410A | R-32 | R-404A | R-290 |
| -20 | 20.9 | 4.5 | 43.4 / 43.2 | 44.1 | 29.9 / 28.9 | 20.7 |
| -10 | 36.7 | 14.4 | 68.6 / 68.3 | 69.8 | 49.0 / 47.7 | 35.4 |
| 0 | 57.6 | 27.7 | 101.4 / 101.1 | 103.3 | 73.8 / 72.4 | 54.1 |
| 10 | 84.1 | 45.4 | 143.2 / 142.6 | 145.9 | 105.3 / 103.6 | 77.6 |
| 20 | 117.3 | 68.2 | 195.2 / 194.6 | 199.1 | 144.5 / 142.6 | 106.6 |
| 30 | 158.2 | 97 | 259.3 / 258.5 | 264.8 | 192.5 / 190.4 | 141.8 |
| 40 | 207.7 | 132.7 | 337.1 / 336.1 | 344.8 | 250.6 / 248.6 | 183.9 |
Saturation Pressure-Temperature Reference Table (Water)
| Temperature (°C) | Temperature (°F) | Saturation Pressure (kPa) | Pressure (bar) |
| 0 | 32 | 0.611 | 0.0061 |
| 10 | 50 | 1.228 | 0.0123 |
| 20 | 68 | 2.339 | 0.0234 |
| 30 | 86 | 4.246 | 0.0425 |
| 40 | 104 | 7.385 | 0.0739 |
| 50 | 122 | 12.352 | 0.1235 |
| 60 | 140 | 19.946 | 0.1995 |
| 70 | 158 | 31.201 | 0.312 |
| 80 | 176 | 47.414 | 0.4741 |
| 90 | 194 | 70.182 | 0.7018 |
| 100 | 212 | 101.325 | 1.0133 |
| 110 | 230 | 143.38 | 1.4338 |
| 120 | 248 | 198.53 | 1.9853 |
| 130 | 266 | 270.1 | 2.701 |
| 140 | 284 | 361.5 | 3.615 |
| 150 | 302 | 476.2 | 4.762 |
Steam Pressure-Temperature Reference Chart
| Temperature (°C) | Temperature (°F) | Pressure (kPa) | Pressure (bar) | Pressure (PSIA) |
| 0 | 32 | 0.612 | 0.0061 | 0.089 |
| 20 | 68 | 2.339 | 0.0234 | 0.339 |
| 40 | 104 | 7.384 | 0.0738 | 1.071 |
| 60 | 140 | 19.946 | 0.1995 | 2.893 |
| 80 | 176 | 47.415 | 0.4742 | 6.878 |
| 100 | 212 | 101.418 | 1.0142 | 14.71 |
| 120 | 248 | 198.665 | 1.9867 | 28.823 |
| 140 | 284 | 361.501 | 3.615 | 52.431 |
| 160 | 320 | 618.139 | 6.1814 | 89.668 |
| 180 | 356 | 1002.6 | 10.026 | 145.4 |
| 200 | 392 | 1554.7 | 15.547 | 225.5 |
| 220 | 428 | 2319.3 | 23.193 | 336.4 |
| 240 | 464 | 3346.6 | 33.466 | 485.4 |
| 260 | 500 | 4692.1 | 46.921 | 680.6 |
| 280 | 536 | 6416.5 | 64.165 | 930.7 |
| 300 | 572 | 8587.7 | 85.877 | 1245.6 |
Gas Pressure-Temperature Reference Chart
| Temperature (°C) | Temperature (K) | Pressure (kPa absolute) | Pressure (bar absolute) | Pressure (PSIA) |
| -20 | 253.15 | 86.4 | 0.864 | 12.53 |
| 0 | 273.15 | 93.2 | 0.932 | 13.52 |
| 20 | 293.15 | 100 | 1 | 14.5 |
| 30 | 303.15 | 103.4 | 1.034 | 15 |
| 40 | 313.15 | 106.8 | 1.068 | 15.49 |
| 50 | 323.15 | 110.2 | 1.102 | 15.98 |
| 60 | 333.15 | 113.6 | 1.136 | 16.48 |
| 70 | 343.15 | 117 | 1.17 | 16.97 |
| 80 | 353.15 | 120.5 | 1.205 | 17.48 |
| 90 | 363.15 | 124 | 1.24 | 17.98 |
| 100 | 373.15 | 127.3 | 1.273 | 18.46 |
How to Read a Pressure-Temperature Chart
To get accurate pressure-temperature chart details, such as the material pressure unit and temperature scaling. Different refrigeration pt charts come with certain temperature values for the column and related saturation pressures in another.
The following steps explain refrigerant P-T chart reading.
First, identify the refrigerant and get details of the refrigerant, like the number or name. Each refrigerant comes with a different pressure-temperature relationship.
Get the temperature value from the chart.
Now obtain the pressure value from the rows to identify the saturation pressure.
With pressure, using the get temperature, when pressure is known, get the pressure column and get the related saturation temperature.
Ensure the pressure unit matches the chart; it uses PSIG, PSIA, bar, or another pressure unit.
Refrigerant Pressure-Temperature (P-T) Chart – Multiple Refrigerants
The chart cmes with R-22, R-134a, R-410A, R-32, R-404A, R-407C, and R-454B, with temperature in °F and °C and pressure in PSIG.
| Temp (°F) | Temp (°C) | R-22 | R-134a | R-410A | R-32 | R-404A B/D | R-407C B/D | R-454B B/D |
| 0 | -17.8 | 24 | 6.5 | 48.4 | 49.3 | 33.7 / 32.6 | 29.5 / 19.4 | 45.3 / 42.7 |
| 10 | -12.2 | 32.8 | 11.9 | 62.4 | 63.5 | 44.3 / 43.1 | 39.5 / 27.9 | 58.5 / 55.4 |
| 20 | -6.7 | 43.1 | 18.4 | 78.7 | 80 | 56.6 / 55.3 | 51.2 / 37.9 | 73.9 / 70.3 |
| 30 | -1.1 | 55 | 26.1 | 97.4 | 99.1 | 70.7 / 69.3 | 64.7 / 49.6 | 91.7 / 87.4 |
| 40 | 4.4 | 68.6 | 35 | 118.8 | 121 | 86.9 / 85.4 | 80.2 / 63.2 | 112.0 / 107.0 |
| 50 | 10 | 84.1 | 45.4 | 143.2 | 145.9 | 105.3 / 103.6 | 97.9 / 78.8 | 135.0 / 129.3 |
| 60 | 15.6 | 101.6 | 57.4 | 170.7 | 174.1 | 126.0 / 124.2 | 118.0 / 96.8 | 161.1 / 154.6 |
| 70 | 21.1 | 121.4 | 71.1 | 201.8 | 205.8 | 149.3 / 147.4 | 140.5 / 117.3 | 190.5 / 183.1 |
| 80 | 26.7 | 143.6 | 86.7 | 236.5 | 241.5 | 175.4 / 173.4 | 165.8 / 140.5 | 223.4 / 215.2 |
| 90 | 32.2 | 168.4 | 104.3 | 275.4 | 281.3 | 204.5 / 202.4 | 194.1 / 166.7 | 260.0 / 251.0 |
| 100 | 37.8 | 195.9 | 124.2 | 318.6 | 325.7 | 236.8 / 234.6 | 225.5 / 196.1 | 300.8 / 290.9 |
| 110 | 43.3 | 226.4 | 146.4 | 366.4 | 374.9 | 272.5 / 270.4 | 260.3 / 229.0 | 345.9 / 335.2 |
| 120 | 48.9 | 260 | 171.2 | 419.4 | 429.3 | 312.1 / 309.9 | 298.6 / 265.8 | 395.7 / 384.3 |
Refrigerants Included in the Chart
| Refrigerant | Full name / Description | Type |
| R-22 | Chlorodifluoromethane | HCFC |
| R-134a | Tetrafluoroethane | HFC |
| R-410A | R-32 and R-125 blend | HFC blend |
| R-32 | Difluoromethane | HFC |
| R-404A | Refrigerant blend | HFC blend |
| R-407C | Refrigerant blend | HFC blend |
| R-454B | R-32 and R-1234yf blend | HFC/HFO blend |