 Hello fellows, I hope you all are doing great. In today’s tutorial, we will have a look at Analyze Amplifier Total Frequency Response. In previous tutorials about low-frequency response and high-frequency response we have discussed that RC circuitry in amplifiers has effect on the frequency response.
In today’s post, we will combine previous discussed concepts and discussed the total response of the amplifier and their related parameters. So let’s get started with Analyze Amplifier Total Frequency Response.
Analyze Amplifier Total Frequency Response
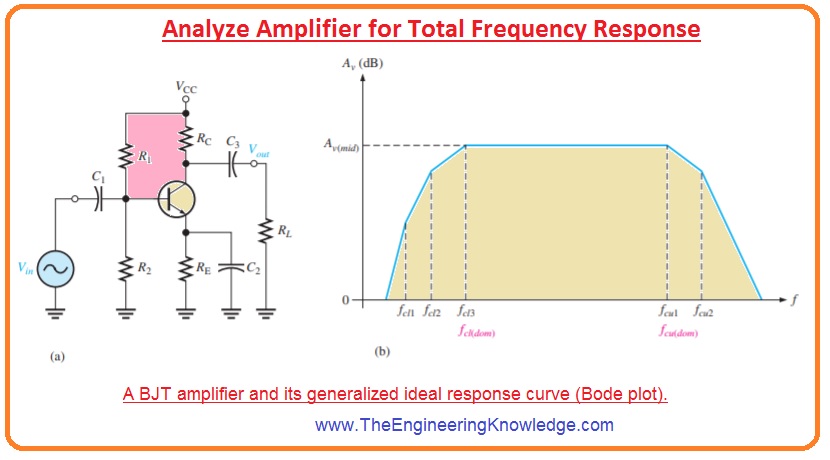
- In below figure denoted as b’ you can see the ideal response curve or Bode plot for bipolar junction transistor amplifier circuitry shown in figure denoted as a’
- In curve you can see that 3 breaking points exit at less critical frequency value ( fcl1, fcl2, and fcl3) are formed by the 3 low-frequency RC circuitry designed by the coupling and bypass capacitors.
- The other 2 breaking points at upper critical frequency values fcu1 and fcu2, are formed by the 2 high-frequency RC circuitry designed with the internal capacitances of transistors.
- Of interest are the 2 main critical frequencies, fcl3 and fcu1, shown I figure denoted as b’.
- These 2 frequency values occur for the voltage gain of an amplifier is three decibels less its midrange values.
- These two frequency values are denoted fcl(dom) and fcu(dom).
- The upper and lower main critical frequency values are sometimes named as the half-power frequencies.
- This terminology is found from the factor that the output power of the amplifier at its critical frequency is half of its midrange power.
- It can be discussed as initiating with the factor that the output voltage is 0.707 of its midrange values at main or critical frequency.
Bandwidth
- The amplifier usually work with signal frequency values among fcl(dom) and fcu(dom).
- If the input signal frequency value is fcl(dom) or fcu(dom), the output signal voltage level will be 70.7 percent of its midrange value or If the signal frequency value is less than fcl(dom), the gain and so the output signal level losses at 20 dB/decade till the value of next critical frequency is gotten.
- The same happens when the signal frequency is larger than fcu(dom).
- The value of frequency existing between fcl(dom) and fcu(dom) is known as the bandwidth of the amplifier, it explained in the below figure.
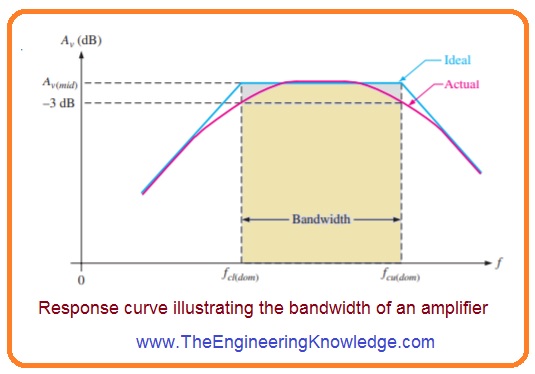
- Only the main or leading critical frequency values exits in the response curve since they find the bandwidth.
- With that sometimes the other critical frequencies are at some distance from the dominant frequencies which have no important role in the total amplifier response and can be ignored.
- The bandwidth of the amplifier is defined in hertz unit.
- In an ideal case, all frequency values existing among the bandwidth of amplifier are amplified at equal bases.
- For instance, if ten millivolts root mean square signal is given to the amplifier having a voltage of twenty it gets amplified to two hundred millivolts root-mean-square for all frequency values in the bandwidth.
- In real the gain value is three decibels at fcl(dom) and fcu(dom).
Gain-Bandwidth Product
- One feature of the amplifier product of voltage gain and bandwidth remains constant when the roll-off is -20 dB/decade.
- This feature is known as the gain-bandwidth product. Let us suppose that the dominant lower critical frequency of a specific amplifier is less than the dominant higher critical frequency.
fcl(dom) << fcu(dom)
- The bandwidth can be mentioned as.
BW = fcu(dom) – fcl(dom)= fcu
Unity-Gain Frequency
- The simplified Bode plot is for this case is drawn in the below figure.
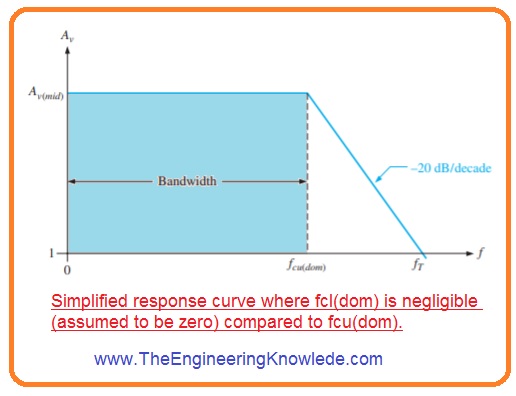
- Note that fcl(dom) is ignored since it is very less than fcu(dom), and the bandwidth almost equals to fcu(dom).
- At starting fcu(dom), the gain rolls off till unity gain zero decibels is obtained.
- The frequency value over which the gain of an amplifier is one is known as unity gain frequency fT.
- The importance of fT is that it is always equal to the midrange voltage gain multiple with the bandwidth and has a constant value for a resultant transistor.
fT=Av(mid )BW
- For the situation shown in above figure fT =Av(mid) fcu(dom).
- For instance, if a transistor datasheet has a value of fT =100 MHz, it shows that a transistor can generate a voltage gain of one to the one hundred megahertz frequency.
What is the frequency range of the amplifier?
- The audio amplifiers amplify signals less than 20 kHz, radio frequency amplifiers amplify frequencies in the range of 20 kHz and 300 GHz, and servo amplifiers and instrumentation amplifiers operate with low frequencies close to direct current.
What is the frequency response of a CE amplifier?
- For the mid-frequency range, larger capacitors are short circuits, and stray capacitors are open circuits, so no capacitance is shown in the middle frequency range. So mid-band frequency gain is highest.
What are the characteristics of frequency response?
- The first one is amplitude response, which defines how output signal amplitude changes with frequency, and the second one is phase response, which explains how output signal phase shifts with frequency.
How to find bandwidth from frequency response?
- Use the bandwidth formula for defining the range of frequency that the system can handle.
- Bandwidth = f_max – f_min.
What is a good frequency response for an amplifier?
- The accurately designed and made output transformer can get 50 50KHZ without peaking. So frequency response of 5kHz to 50kHz in 1dB is common, and 20Hz to 20kHz is the narrow result.
- Some amplifiers come with a flatter frequency response than a wider bandwidth, which is rare.
That is a detailed post about Analyze Amplifier Total Frequency Response if you have any query ask in comments. Thanks for reading. Have a good day